You Can Prove to Yourself the Earth is Not Flat.
My curiosity was piqued in 2017 by an Atheist friend of mine who, knowing I was a Christian at the time, accused me of being a Flat Earther. I was blown away by the accusation, and he defended himself with the claims he heard in a deep, deep rabbit hole of a Facebook group (Ironically, it was through this group I met a dude—no longer a Flat Earther—who’s still one of my best friends, 7 years later!)
I spent some time reading the ridiculous memes until I felt emboldened to start commenting. I was met with some of the most dedicated mental gymnasts I’ve ever known. These people, for whatever reason(s), needed to see the Earth be round with their own eyes.
Challenge accepted.
I went to “the YouTube” and tumbled like Alice into an ADHD-hyperfixation-fueled trip to an alternate universe, where ships don’t really disappear over curved horizons, NASA is satanic, and gravity doesn’t even exist. There, I found out about their cosmological Bible—Zetetic Astronomy—and read it. Oof.
None of the arguments I raised against the book were accepted. They had to see it.
So, I devised several of my own experiments. Here are just 3 of them.
Experiment #1 - Lunar Shadow during Solar Eclipse
If you live in the United States and want the pleasure of witnessing a total solar eclipse, April 8, 2024 will be the last chance you’ll get to see one domestically until 2044! Here is the lunar transit’s predicted path and degree of totality for all 50 states.
During your road trip, consider the following premises:
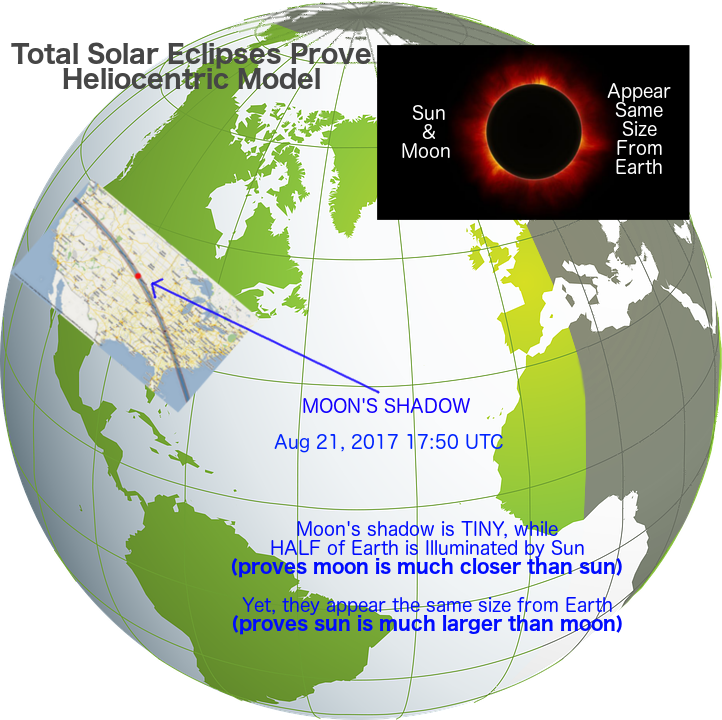
- Viewed from Earth, the Sun and Moon are approximately the same angular size.
- On a Flat Earth model, the Sun and Moon are approximately the same distance from Earth.
- On a Globe Earth model, the Moon is much closer to our surface, and much smaller than the Sun.
- Using the Moon’s known position and trajectory, we can predict with high accuracy where the Moon will be (at least for the next ten-thousand years or so).
Should you be lucky enough to observe a total solar eclipse (or just verify with any trustworthy friends in the area), you can devise a simple experiment:
- If the Flat Earth model is correct, and the Moon moves directly in front of the Sun, most if not all the Earth will darken (the Moon blocks most if not all the Sun).
- If the Globe Earth model is correct, only a (relatively) small lunar shadow should be observed, following a path calculated from the curvature of the Earth and the relative position of the smaller and closer Moon.
- Have one individual observe the eclipse from the expected path of totality, and another far enough away to avoid the eclipse altogether.
I personally witnessed a total solar eclipse on August 21, 2017. I was close enough to the path of totality to get a partial darkening, which was very exciting to look at through a round hole in a piece of paper, projecting the crescent onto another piece of paper. I could confirm with ample, independent samples that people along the path of totality got total darkness, and those too far away observed no darkening, at all.
This is the post that got me banned from that group:
I did get to debate Nathan Thompson on a 3-way call after that, and it ended with him hanging up on us and spamming us with Flat Earth memes.
Experiment #2 — To Warp, or Not to Warp?
Let’s imagine you have an inflatable beach ball, on which is painted the “globe map” the elite are using to hide from our children that the Earth is flat ;)
If you wanted to show the truth of what the “real” Earth map really looked like, using only the surface of that ball perfectly flattened against the floor, how would you do it? At minimum, you’d have to do some combination of cutting and stretching until it laid perfectly flat and laid out correctly. Try it!
Now let’s say I give you a correct flat map of the Earth, just on a disk-shaped piece of paper. How could you represent that on the floor? You could just put it down. Done.
You can put a 2D map flat on a 2D floor without warping anything.
A sphere is a 3D circle. The reason you can’t just put a 3D ball’s surface flat on the floor without cutting and stretching is because you’re trying to shove three independent dimensions into two. The third dimension has to be represented between the other two somehow, and this requires warping them.
So… what if we could somehow reliably capture a numerical representation of the Earth’s true surface (without needing to know its shape), supervising the data with our own eyes?
The fun thing about math is that it can be used to describe and predict reality, and with a little ingenuity, sometimes with surprising accuracy!
-
Find a website that reports the sunrise and sunset times for any location on Earth, and personally verify their accuracy with your own eyes (time the sunset and sunrise). You can even find a few friends online you can trust that live in other timezones, and have them verify whether the sun really did rise and set at the website-predicted times. I used https://www.timeanddate.com, but you can analyze your own.
-
Take this (now independently verified) data of sunrise and sunset times, and check it against a mathematical algorithm for calculating the Earth’s “nightshade.” These websites use the Greenwich hour angle and a few other accommodations to predict sunrise and sunset. Below is the open-source code used by a popular python package called
nightshade:
class Nightshade(ShapelyFeature):
    def __init__(self, date=None, delta=0.1, refraction=-0.83,
                 color="k", alpha=0.5, **kwargs):
        """
        Shade the darkside of the Earth, accounting for refraction.

        Parameters
        ----------
        date : datetime
            A UTC datetime object used to calculate the position of the sun.
            Default: datetime.datetime.utcnow()
        delta : float
            Stepsize in degrees to determine the resolution of the
            night polygon feature (``npts = 180 / delta``).
        refraction : float
            The adjustment in degrees due to refraction,
            thickness of the solar disc, elevation etc...

        Note
        ----
            Matplotlib keyword arguments can be used when drawing the feature.
            This allows standard Matplotlib control over aspects such as
            'color', 'alpha', etc.

        """
        if date is None:
            date = datetime.datetime.utcnow()

        # make sure date is UTC, or naive with respect to time zones
        if date.utcoffset():
            raise ValueError('datetime instance must be UTC, not {0}'.format(
                             date.tzname()))

        # Returns the Greenwich hour angle,
        # need longitude (opposite direction)
        lat, lon = _solar_position(date)
        pole_lon = lon
        if lat > 0:
            pole_lat = -90 + lat
            central_lon = 180
        else:
            pole_lat = 90 + lat
            central_lon = 0

        rotated_pole = ccrs.RotatedPole(pole_latitude=pole_lat,
                                        pole_longitude=pole_lon,
                                        central_rotated_longitude=central_lon)

        npts = int(180/delta)
        x = np.empty(npts*2)
        y = np.empty(npts*2)

        # Solve the equation for sunrise/sunset:
        # https://en.wikipedia.org/wiki/Sunrise_equation#Generalized_equation
        # NOTE: In the generalized equation on Wikipedia,
        #       delta == 0. in the rotated pole coordinate system.
        #       Therefore, the max/min latitude is +/- (90+refraction)

        # Fill latitudes up and then down
        y[:npts] = np.linspace(-(90+refraction), 90+refraction, npts)
        y[npts:] = y[:npts][::-1]

        # Solve the generalized equation for omega0, which is the
        # angle of sunrise/sunset from solar noon
        omega0 = np.rad2deg(np.arccos(np.sin(np.deg2rad(refraction)) /
                                      np.cos(np.deg2rad(y))))

        # Fill the longitude values from the offset for midnight.
        # This needs to be a closed loop to fill the polygon.
        # Negative longitudes
        x[:npts] = -(180 - omega0[:npts])
        # Positive longitudes
        x[npts:] = 180 - omega0[npts:]

        kwargs.setdefault('facecolor', color)
        kwargs.setdefault('alpha', alpha)

        geom = sgeom.Polygon(np.column_stack((x, y)))
        self.geom = geom
        return super(Nightshade, self).__init__(
            [geom], rotated_pole, **kwargs)
So long as this formula accurately predicts when the sun will rise and set anywhere on Earth throughout any year, we know it is correct on both globe and flat models.
We can now use this independently-verifiable nightshade area as a good representation of the real surface of the Earth, at any location, and any time. Specifically, we can see the real shape of light on the real surface in real time!
Now I think we should take this real map of the Earth’s surface, and try to lay it flat it on a floor.
Why should we do that? It’s pretty simple: If the Earth really is flat, there should be no warping on the image when the verified, real-world sunrise/sunset calculation is projected onto a flat model. This should be like dropping a 2D map on a 2D floor.
If the real-world data comes from something resembling a sphere (a 3D circle), we should see an extra dimension getting squeezed and warped in between the original two. If we see (with our own eyes) warping on the flat model, and none on the globe projection, then we’ll know there was a reduction of dimension (i.e. from a non-flat Earth to a flat model of Earth).
If we don’t see the sunlight boundary warping (as if being projected from spherical data), then we’ll know the Earth really is flat.
Flat Earth -> Flat Model: No Warping.
Globe Earth -> Globe Model: No Warping.
Flat Earth -> Globe Model: Warping.
Globe Earth -> Flat Model: Warping.
Clear enough?
As a side-note, this phenomenon is why on the most popular Flat Earth map, which is an azimuthal-equidistant projection of a globe onto a flat plane, the continents are accurate in the North-South dimension, but warped in the East-West dimension, and why the further you get from the North Pole, the higher the warping (Australia looks super stretched!)
We can use a script to project the verified, real-world sunrise/sunset calculations onto a Flat Earth model, and then onto a Globe Earth model. Below is the source code of the script I used, but feel free to write your own! It loops through 73 days (every 5th day, for a year), calculates the nightshade at 7PM CT (0AM UTC), and draws a shaded area to show the area under night.
import numpy as np
from mpl_toolkits.basemap import Basemap
import matplotlib.pyplot as plt
from datetime import datetime, timedelta
import cv2
import os

for x in range(0,73):
    # For globe projection
	map = Basemap(projection='ortho',lat_0=0,lon_0=-75.2)
	# For AE projection
	# map = Basemap(projection='aeqd',lat_0=90,lon_0=0)
	map.drawlsmask(land_color='coral',ocean_color='aqua',lakes=True)
	date = datetime(year=2018, month=1, day=1) + timedelta(days=(x*5))
	CS=map.nightshade(date)
	plt.title('Day/Night Map for %s (UTC)' % date.strftime("%d %b %Y %H:%M:%S"))
	plt.savefig('%s.png' % date.strftime("%Y-%m-%d"))
	plt.clf()

image_folder = '.'
video_name = 'GOES-16-location-7PMCDT-every-5-days-ortho.mp4'

images = [img for img in sorted(os.listdir(image_folder)) if img.endswith(".png")]
frame = cv2.imread(os.path.join(image_folder, images[0]))
height, width, layers = frame.shape
codec = cv2.VideoWriter_fourcc(*'mp4v')
video = cv2.VideoWriter(video_name, codec, 20, (width,height))

for image in images:
	video.write(cv2.imread(os.path.join(image_folder, image)))

cv2.destroyAllWindows()
video.release()
Here’s what it looks like when I project the independently verifiable, real-world sunrise/sunset calculations onto a globe model. Each frame represents the sunlight on Earth at 7PM CT, as the animation loops through every 5th day of 2019. As you can see, there’s no obvious warping, hinting that the real-world data isn’t being projected onto a model having a different number of dimensions (2D v. 3D, i.e. real-world globe to globe model).
On the other hand, when projecting the independently verifiable, real-world sunrise/sunset calculations onto a flat model, there is clear, spherical warping, demonstrating a change in dimensions (real-world round to model flat):
Experiment #3 — Vibrations: A Third Witness
Even if NOAA’s GOES-16 satellite was lying to us about the shape of the Earth, it’s still showing us the nightshade area, and the angle of the Sun against the terrain of the Earth, and all kinds of Earth processes reflecting various frequencies of light, which we can verify with our own eyes.
Let’s have some fun with this one.
I found a way to collect and process raw data from the publicly accessible point in the Western sky called GOES-16’s “geostationary orbit” (or did NASA install sensors in the firmament 0_o??) When I select from its sensors, combine data from them, and map them onto a globe model and a flat model, I can compare it with those real-world sunrise/sunset calculations we worked with earlier, and get almost the exact same thing:
The reason it’s “almost” the same thing is because my cartoon model doesn’t account for brightness variance or exposure contrast. On the real Earth, night doesn’t arrive with a quick snap, but a gradual darkening. We can get ourselves a bit closer to the cartoon’s sunrise/sunset line if we over-brighten the image:
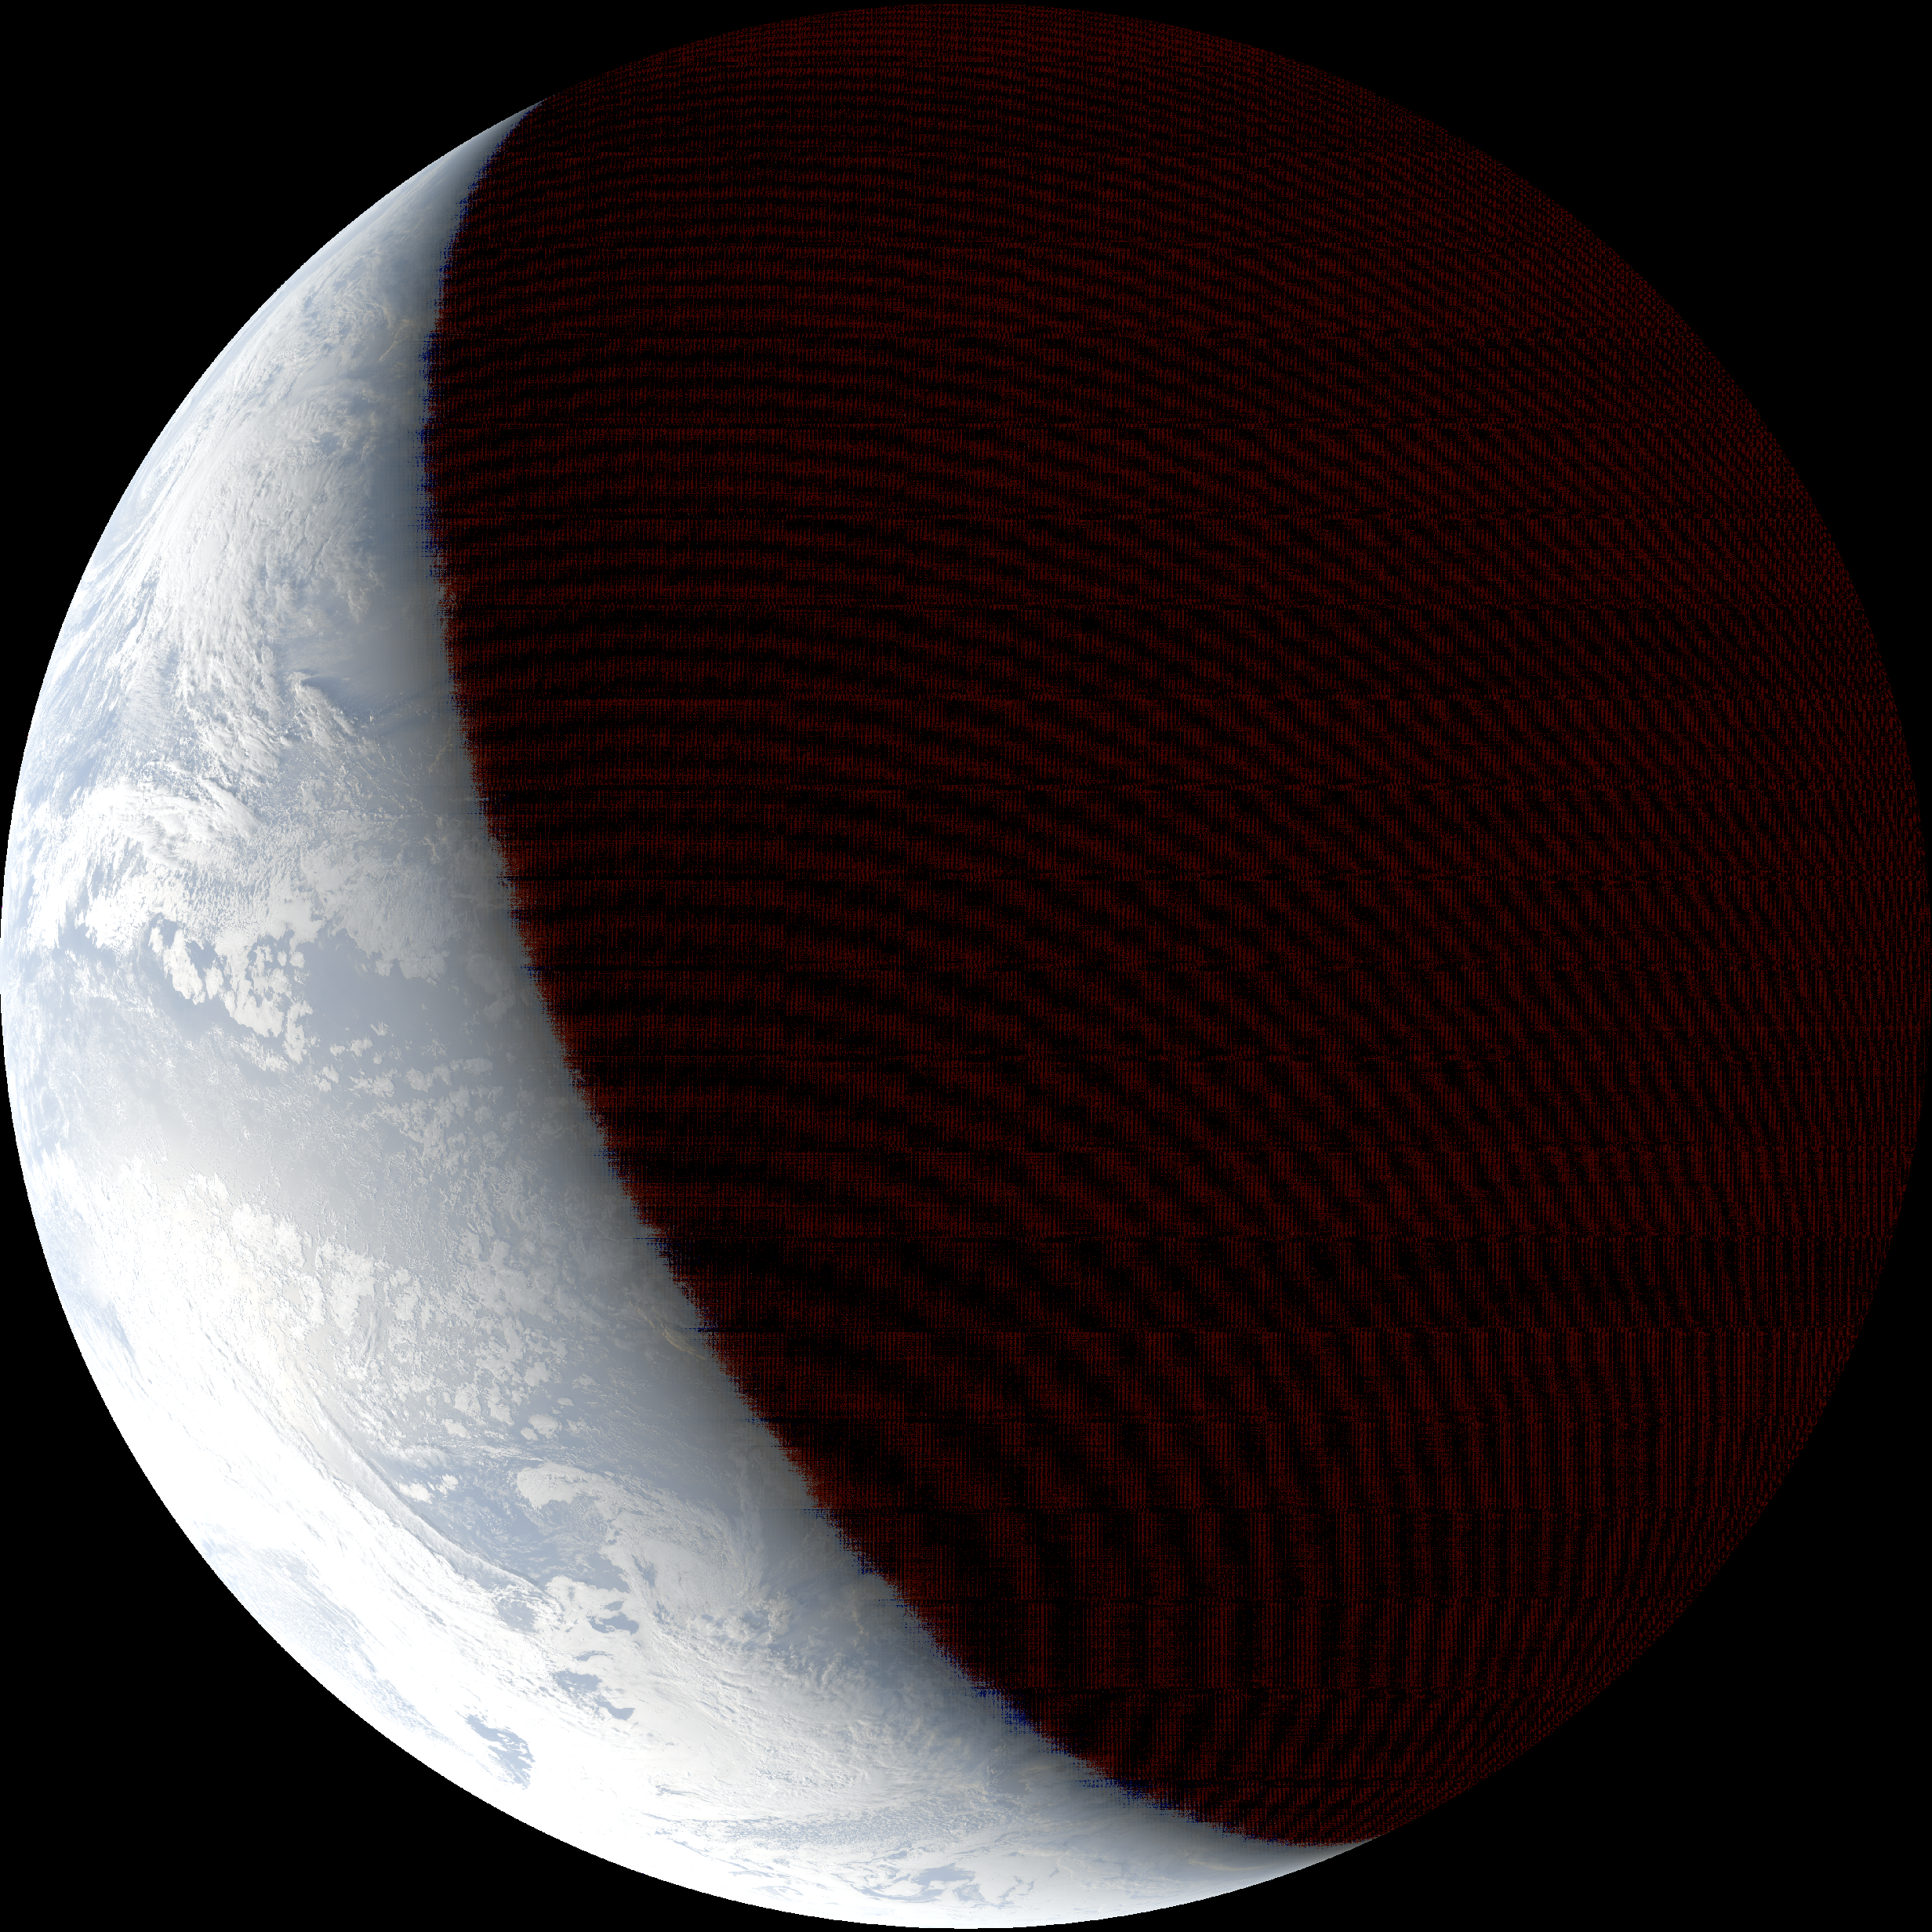
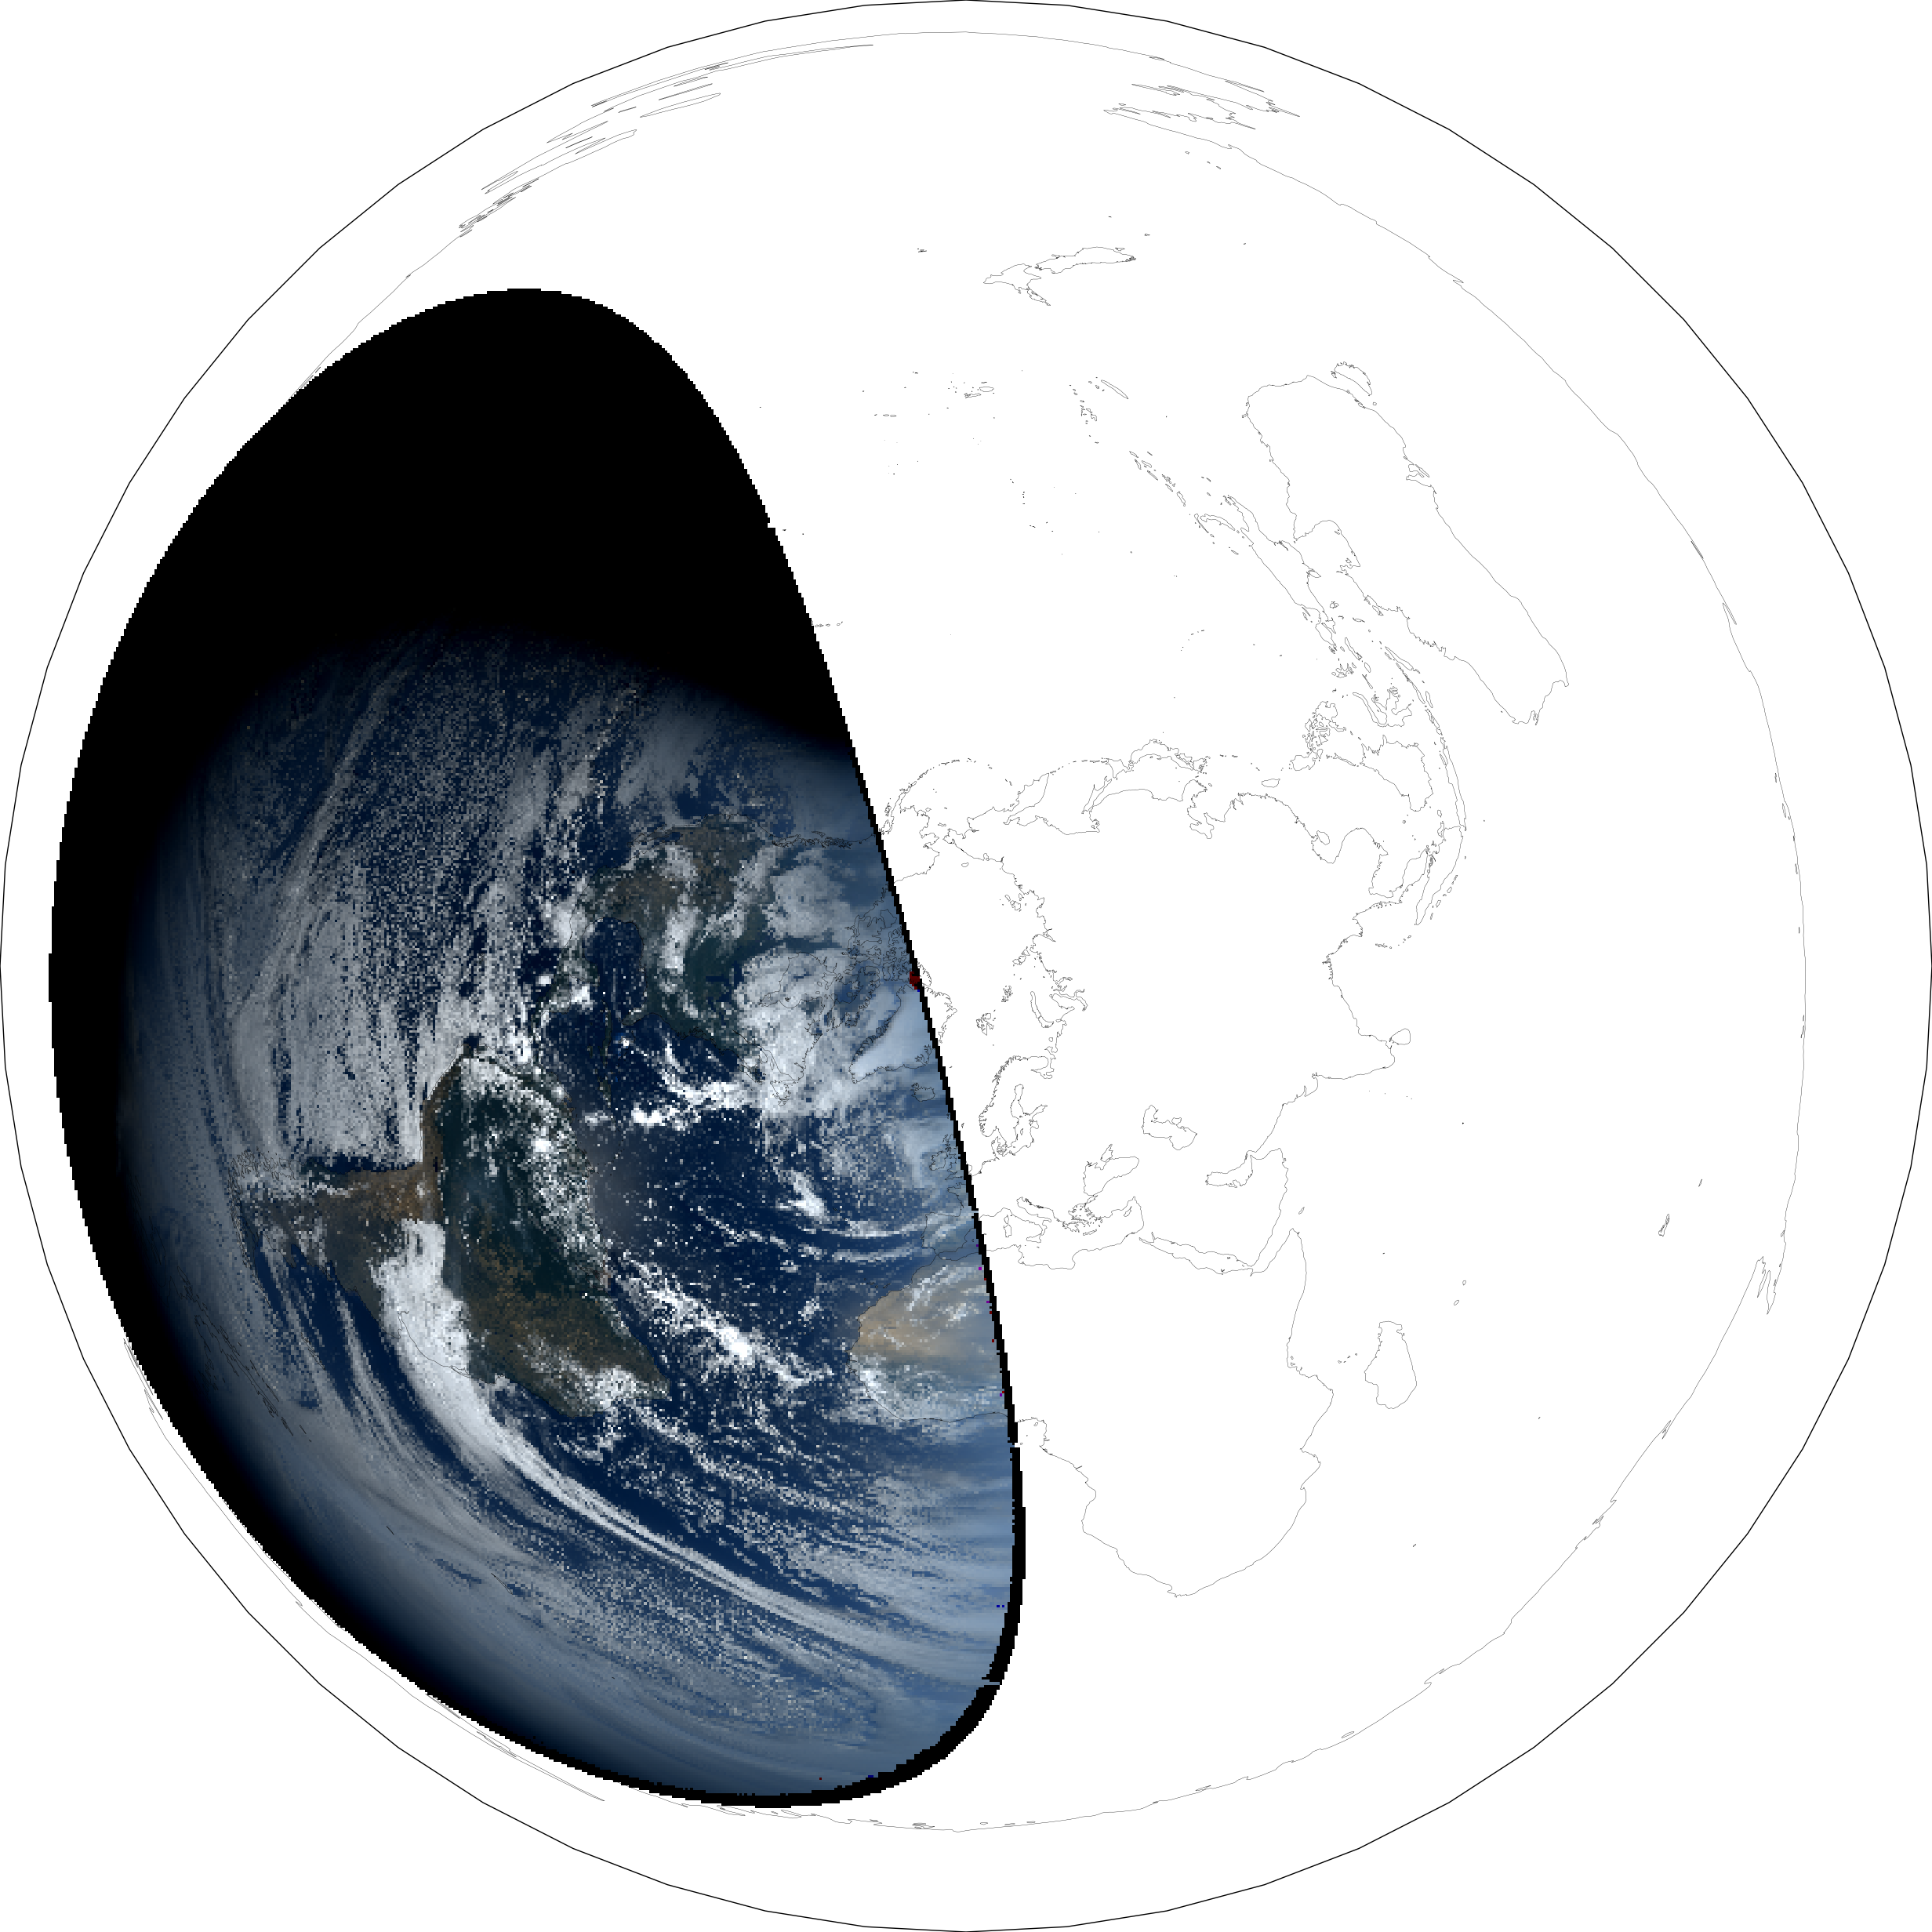
Here’s what happens when I try to project the GOES-16 data onto a Flat Earth model:
Let’s go back to the 2017 eclipse and see if these sensors picked up the path of totality! Interestingly, the entire Earth is not engulfed in darkness when the Moon covers the Sun (demonstrating the Moon must be smaller and closer than the Sun):
I love watching the bright circle of noon’s reflection run over the planet. Here’s the Continental U.S. view of the GOES-16, over-brightened to show the actual totality:
Finally, here’s what it looks like when I project the above area’s data onto a Flat Earth model:
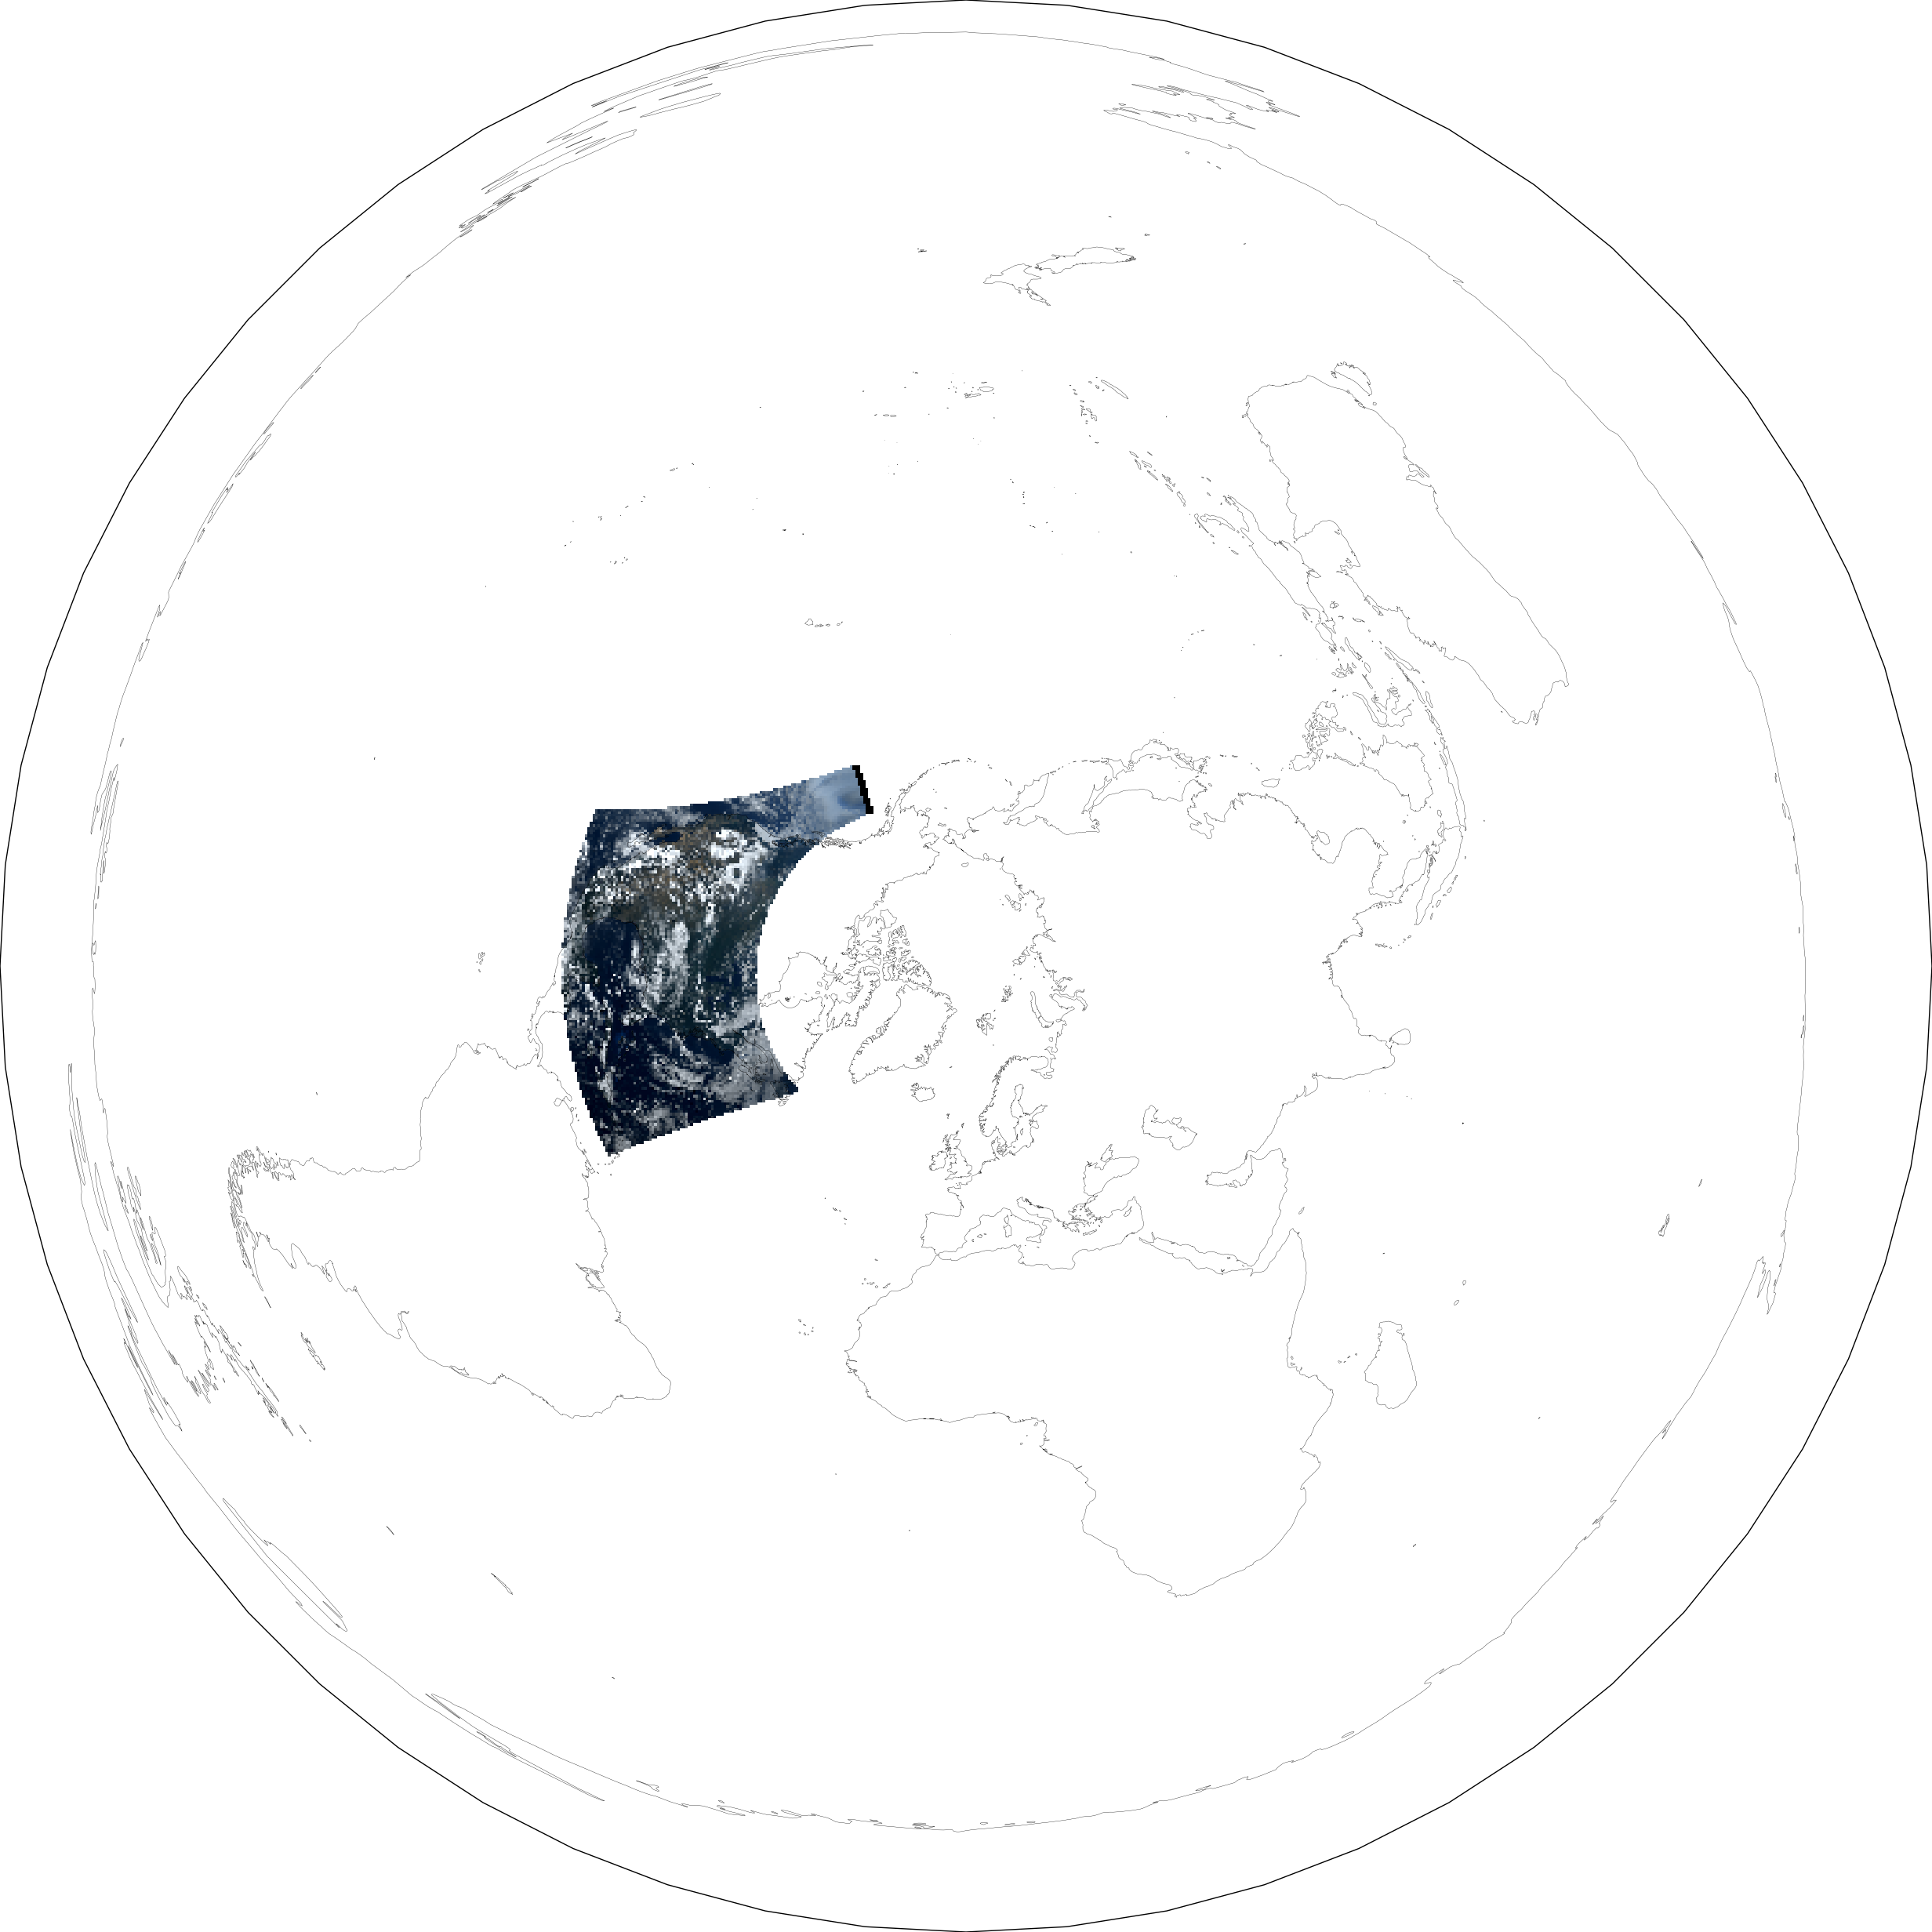
You can see how looking at a patch of curved surface from the Southeast, from a high altitude, causes the top-left corner to stretch disproportionately far. Seems we’ve smushed a third dimension between two…
GOES-16 Data Process:
I used the process designed by Blaylock and Chastang, which works like this:
If you’re too paranoid to rely on NOAA’s AWS buckets, you can point a homemade dish at the geostationary GOES-16 satellite and convert the signals to Numerical Control (*.nc) format (instructions by lxe on GitHub).
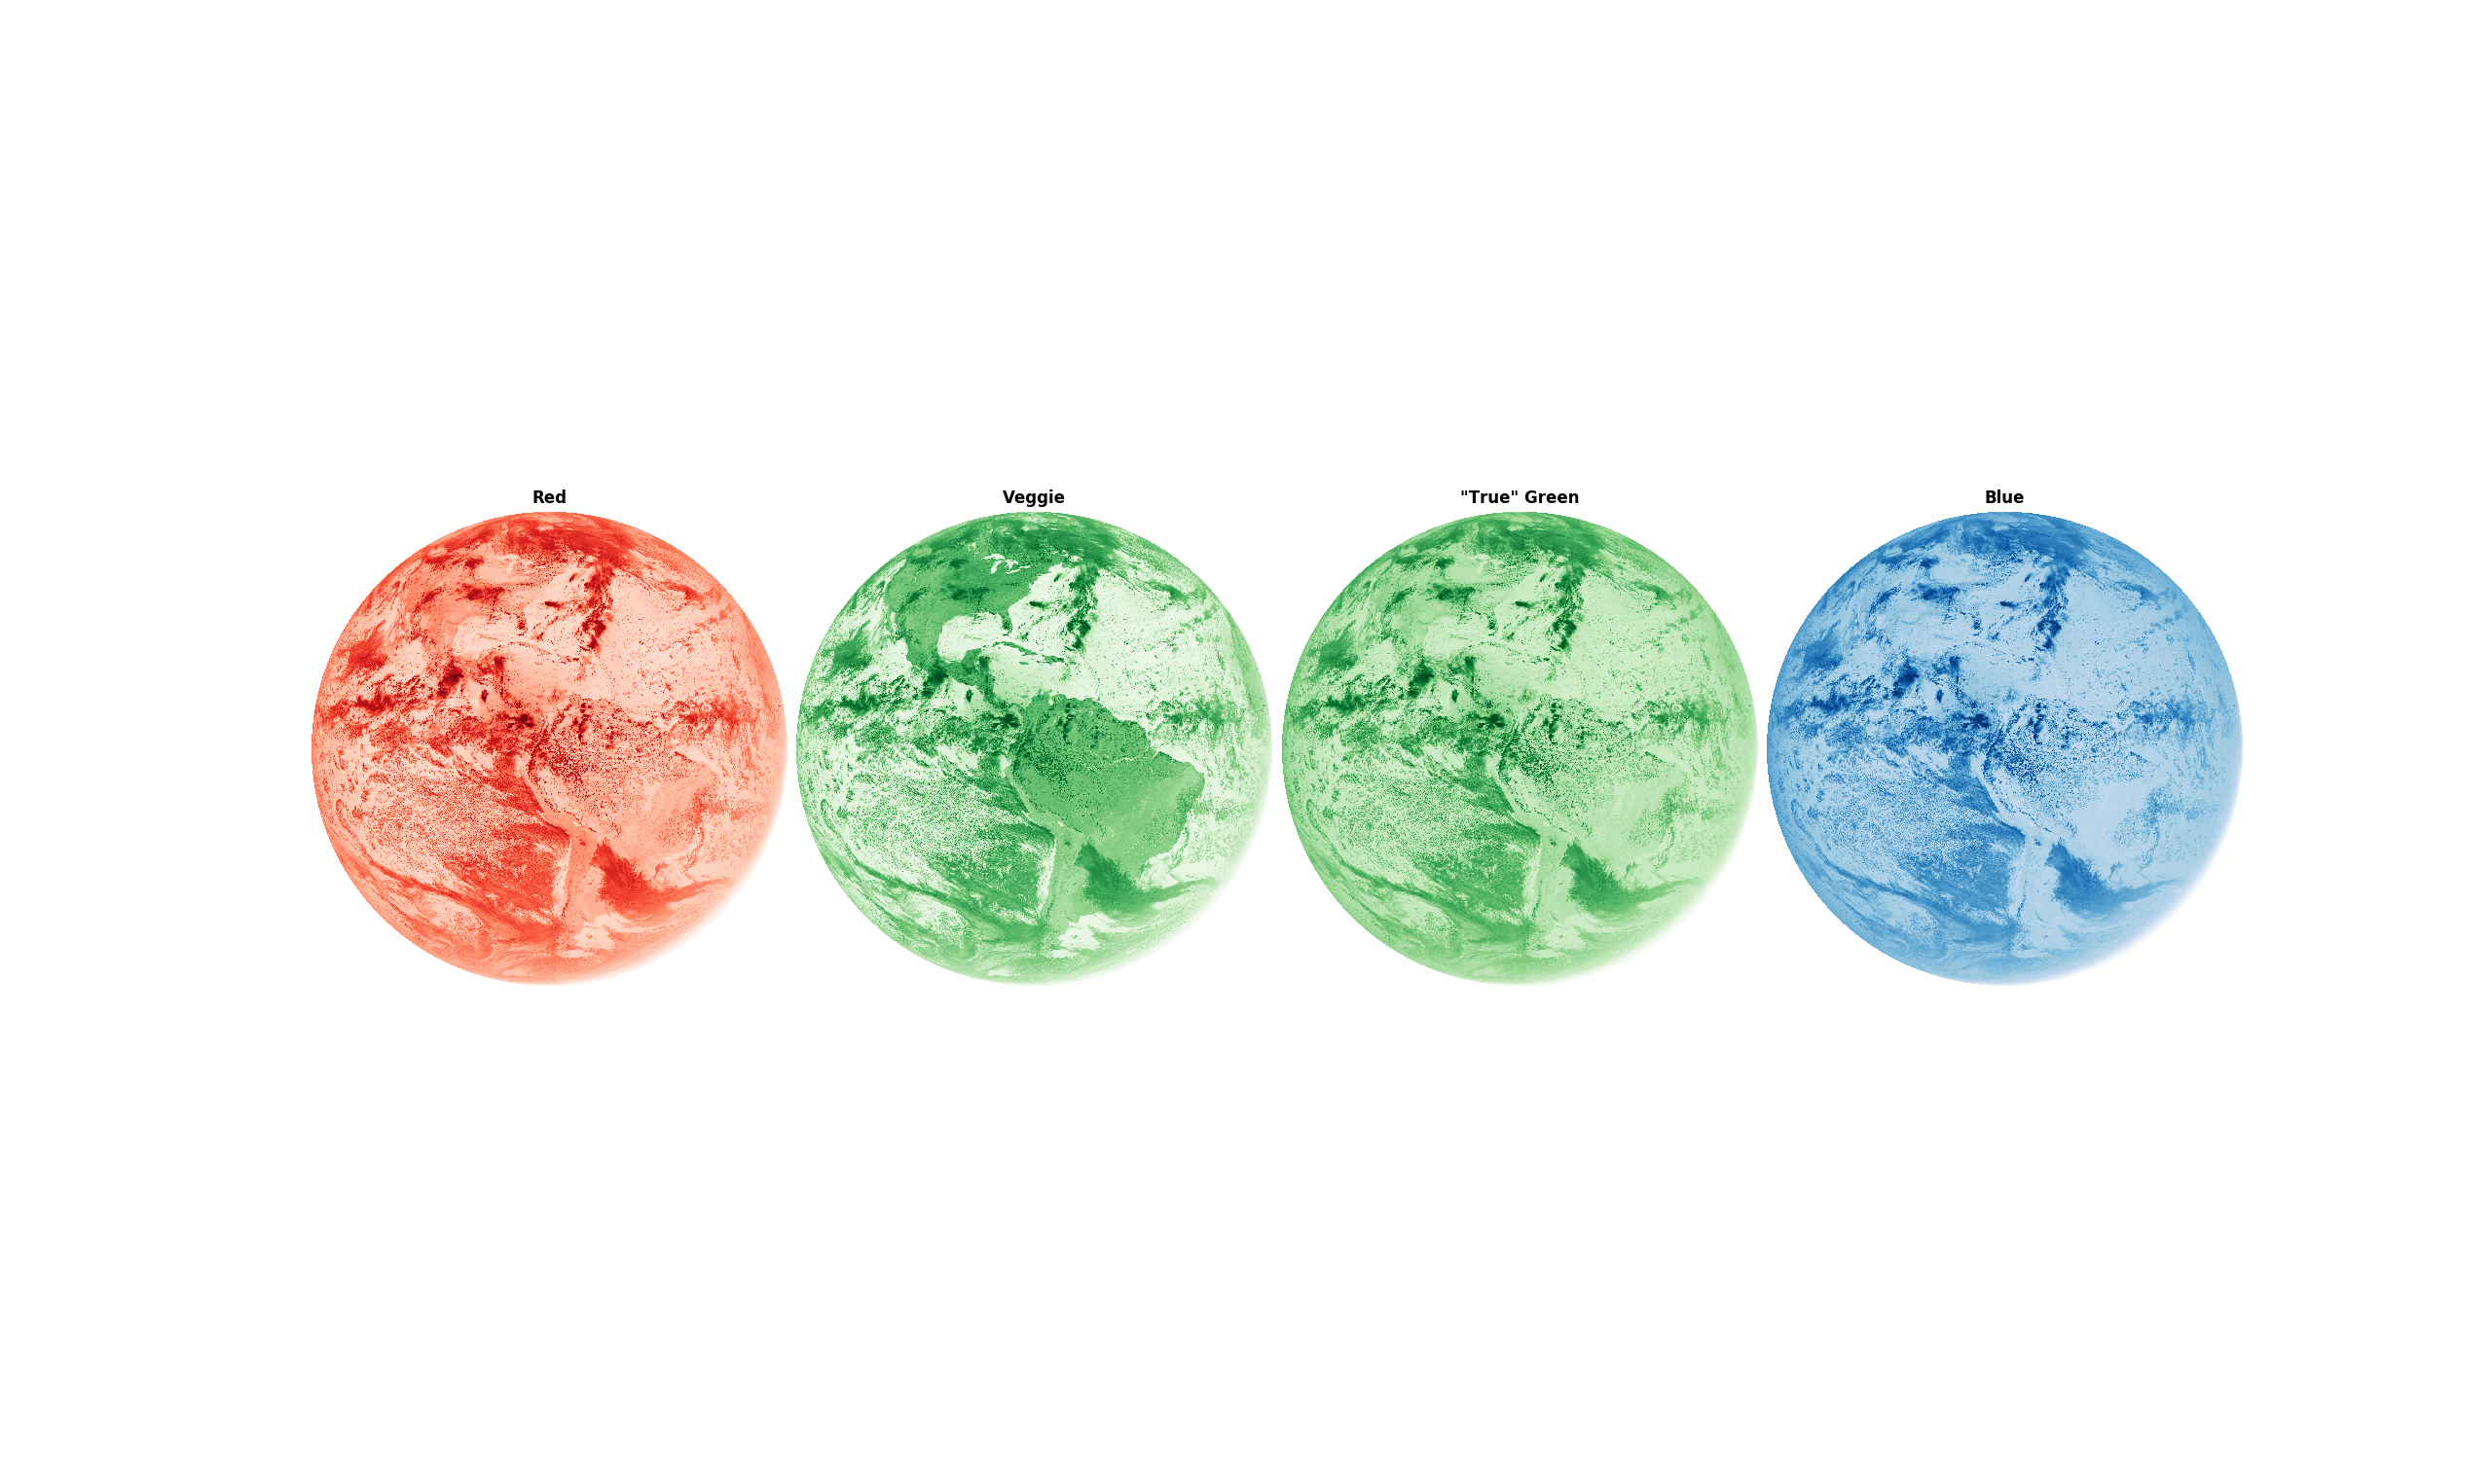
First, you have to convert the raw data into separate color channels. Using the GOES-16’s public specifications, you can find the closest sensors matching red, green, and blue wavelengths:

Using the color chart above, it looks like Sensors 2 (0.64µm) and 1 (0.47µm) are our best matches for red and blue, specifically. There is no sensor close to green, but thankfully we have one built to detect the near-infrared wavelengths emitted by chlorophyll during photosynthesis, and there shouldn’t be much green on Earth produced a different way. We can use Sensor 3 (0.86µm), and apply a manual adjustment to bring it to ~0.52µm (visible green).
Below is a snapshot of the individual sensors, projected onto a globe model (including the conversion of the 0.86µm sensor to visible green):
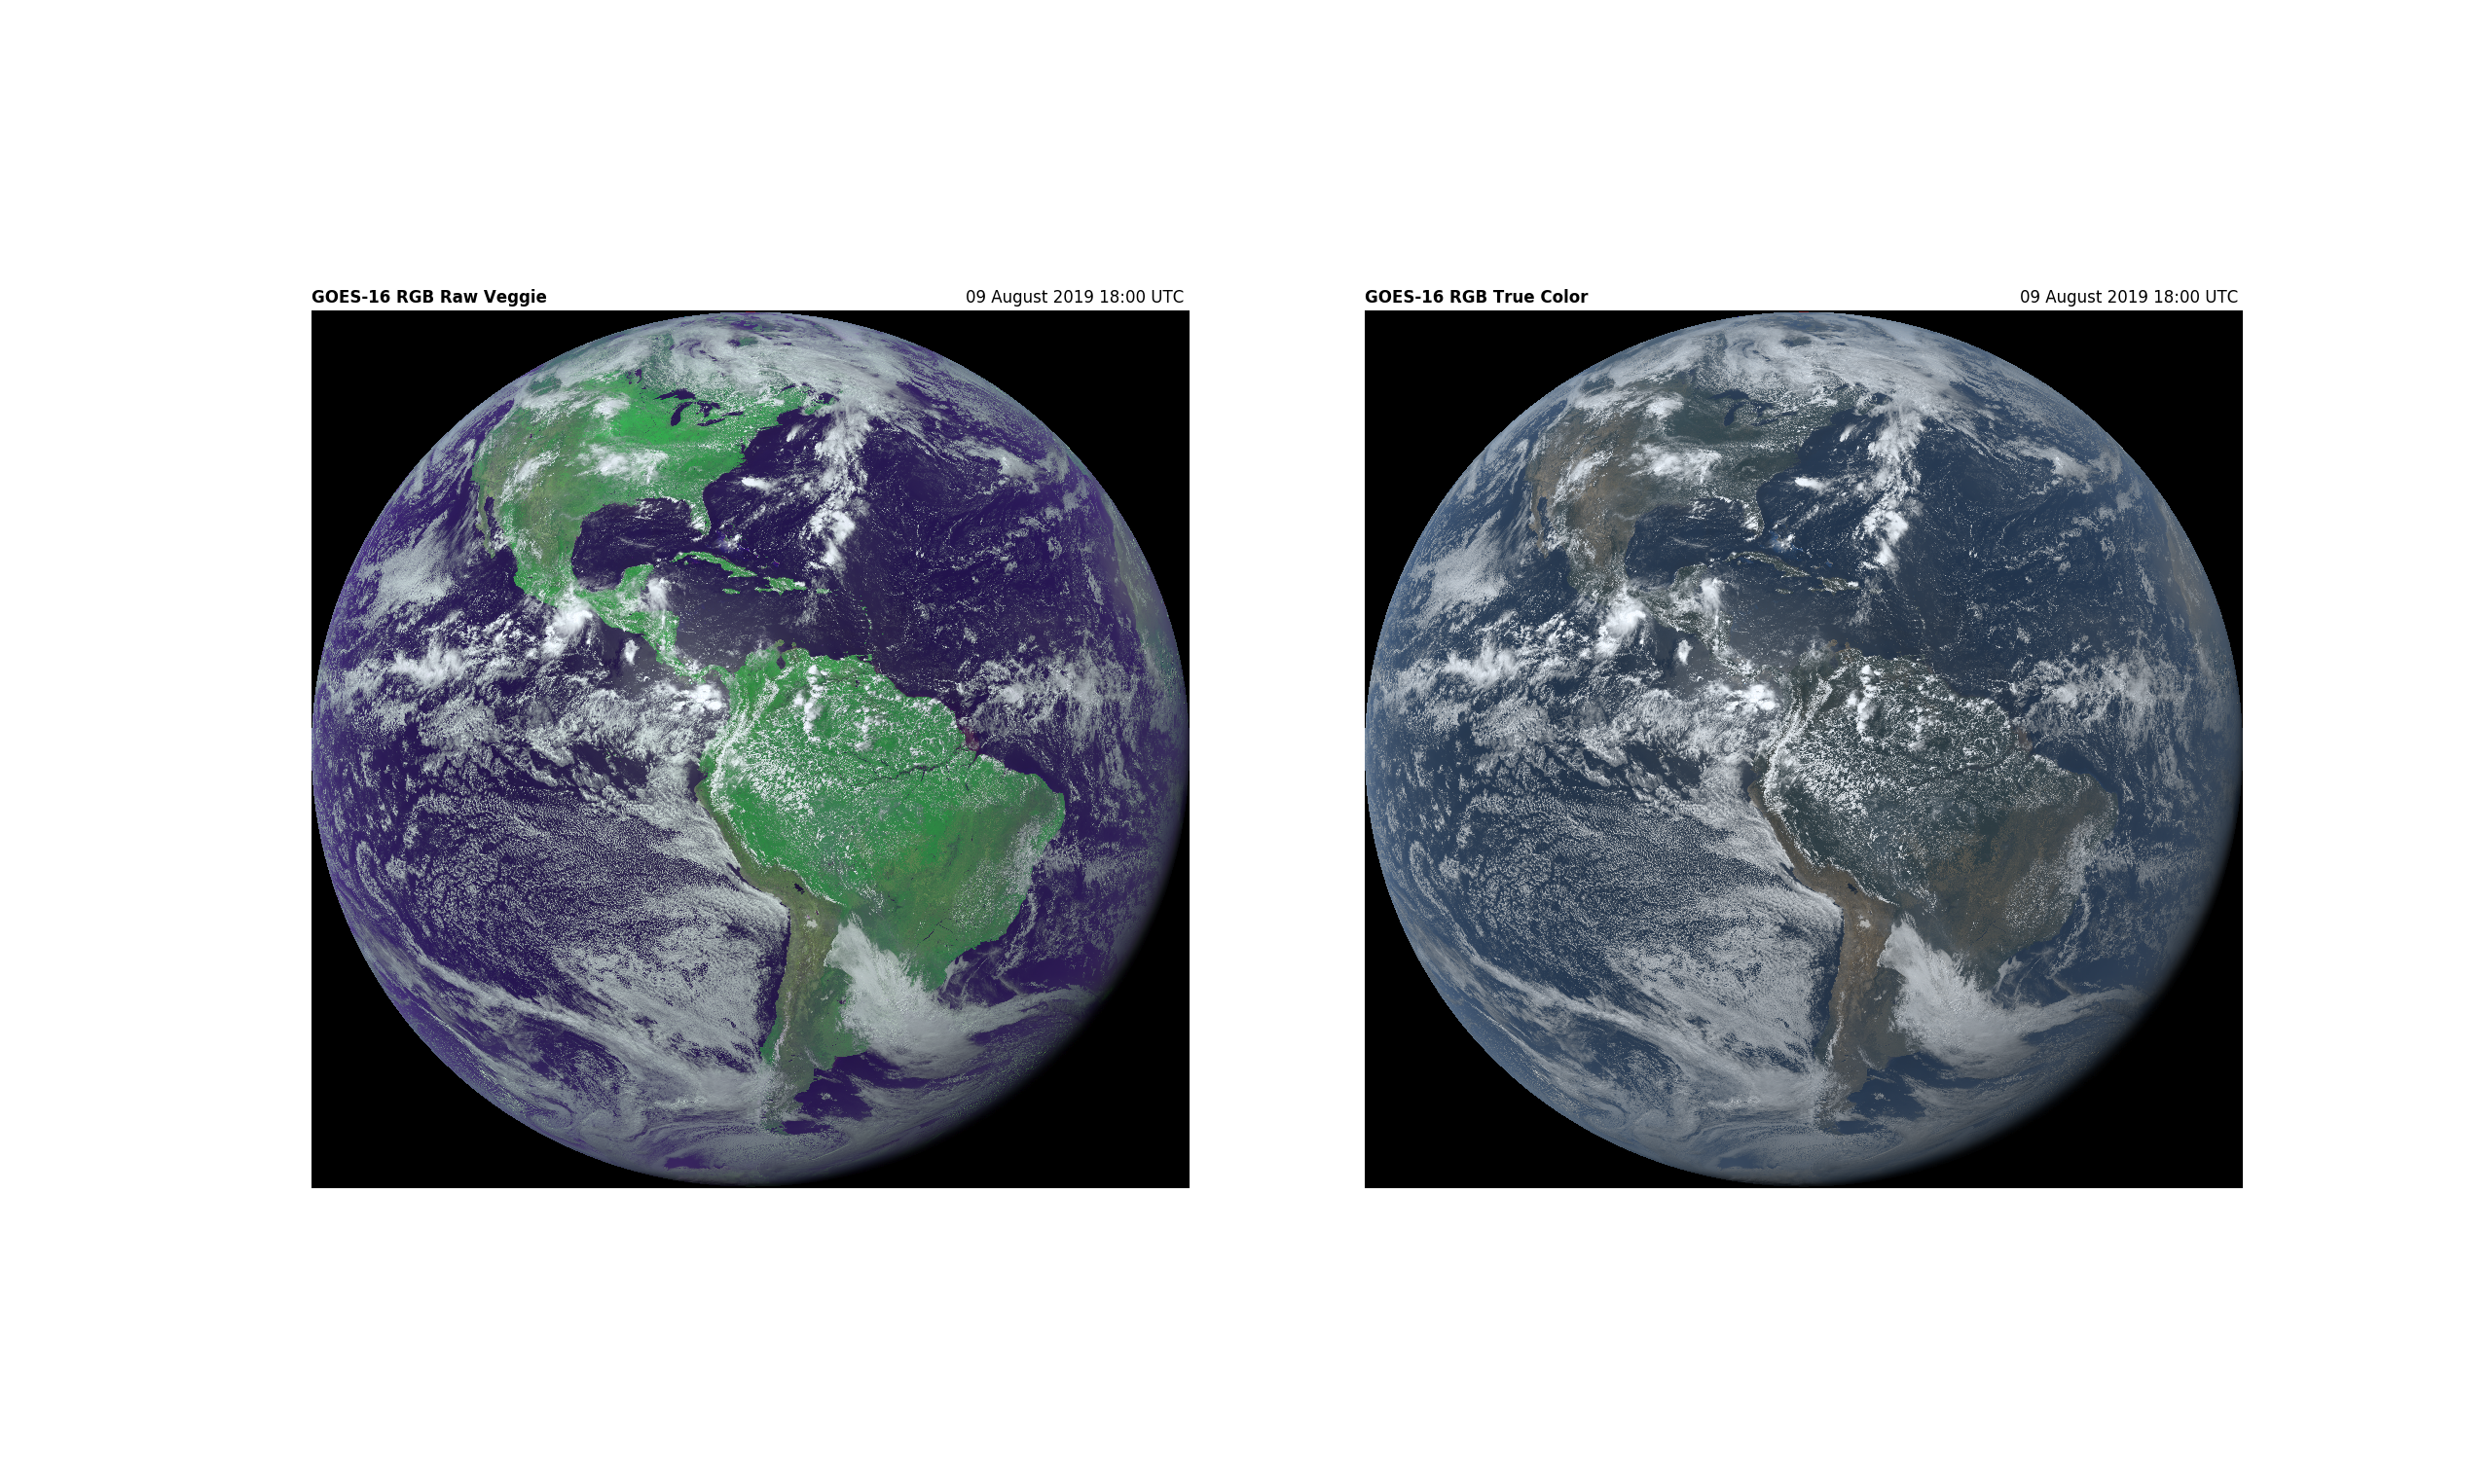
These individual channels can be combined into one “True Color” image. You can see why it’s important to tone down the “green” sensor’s signal:
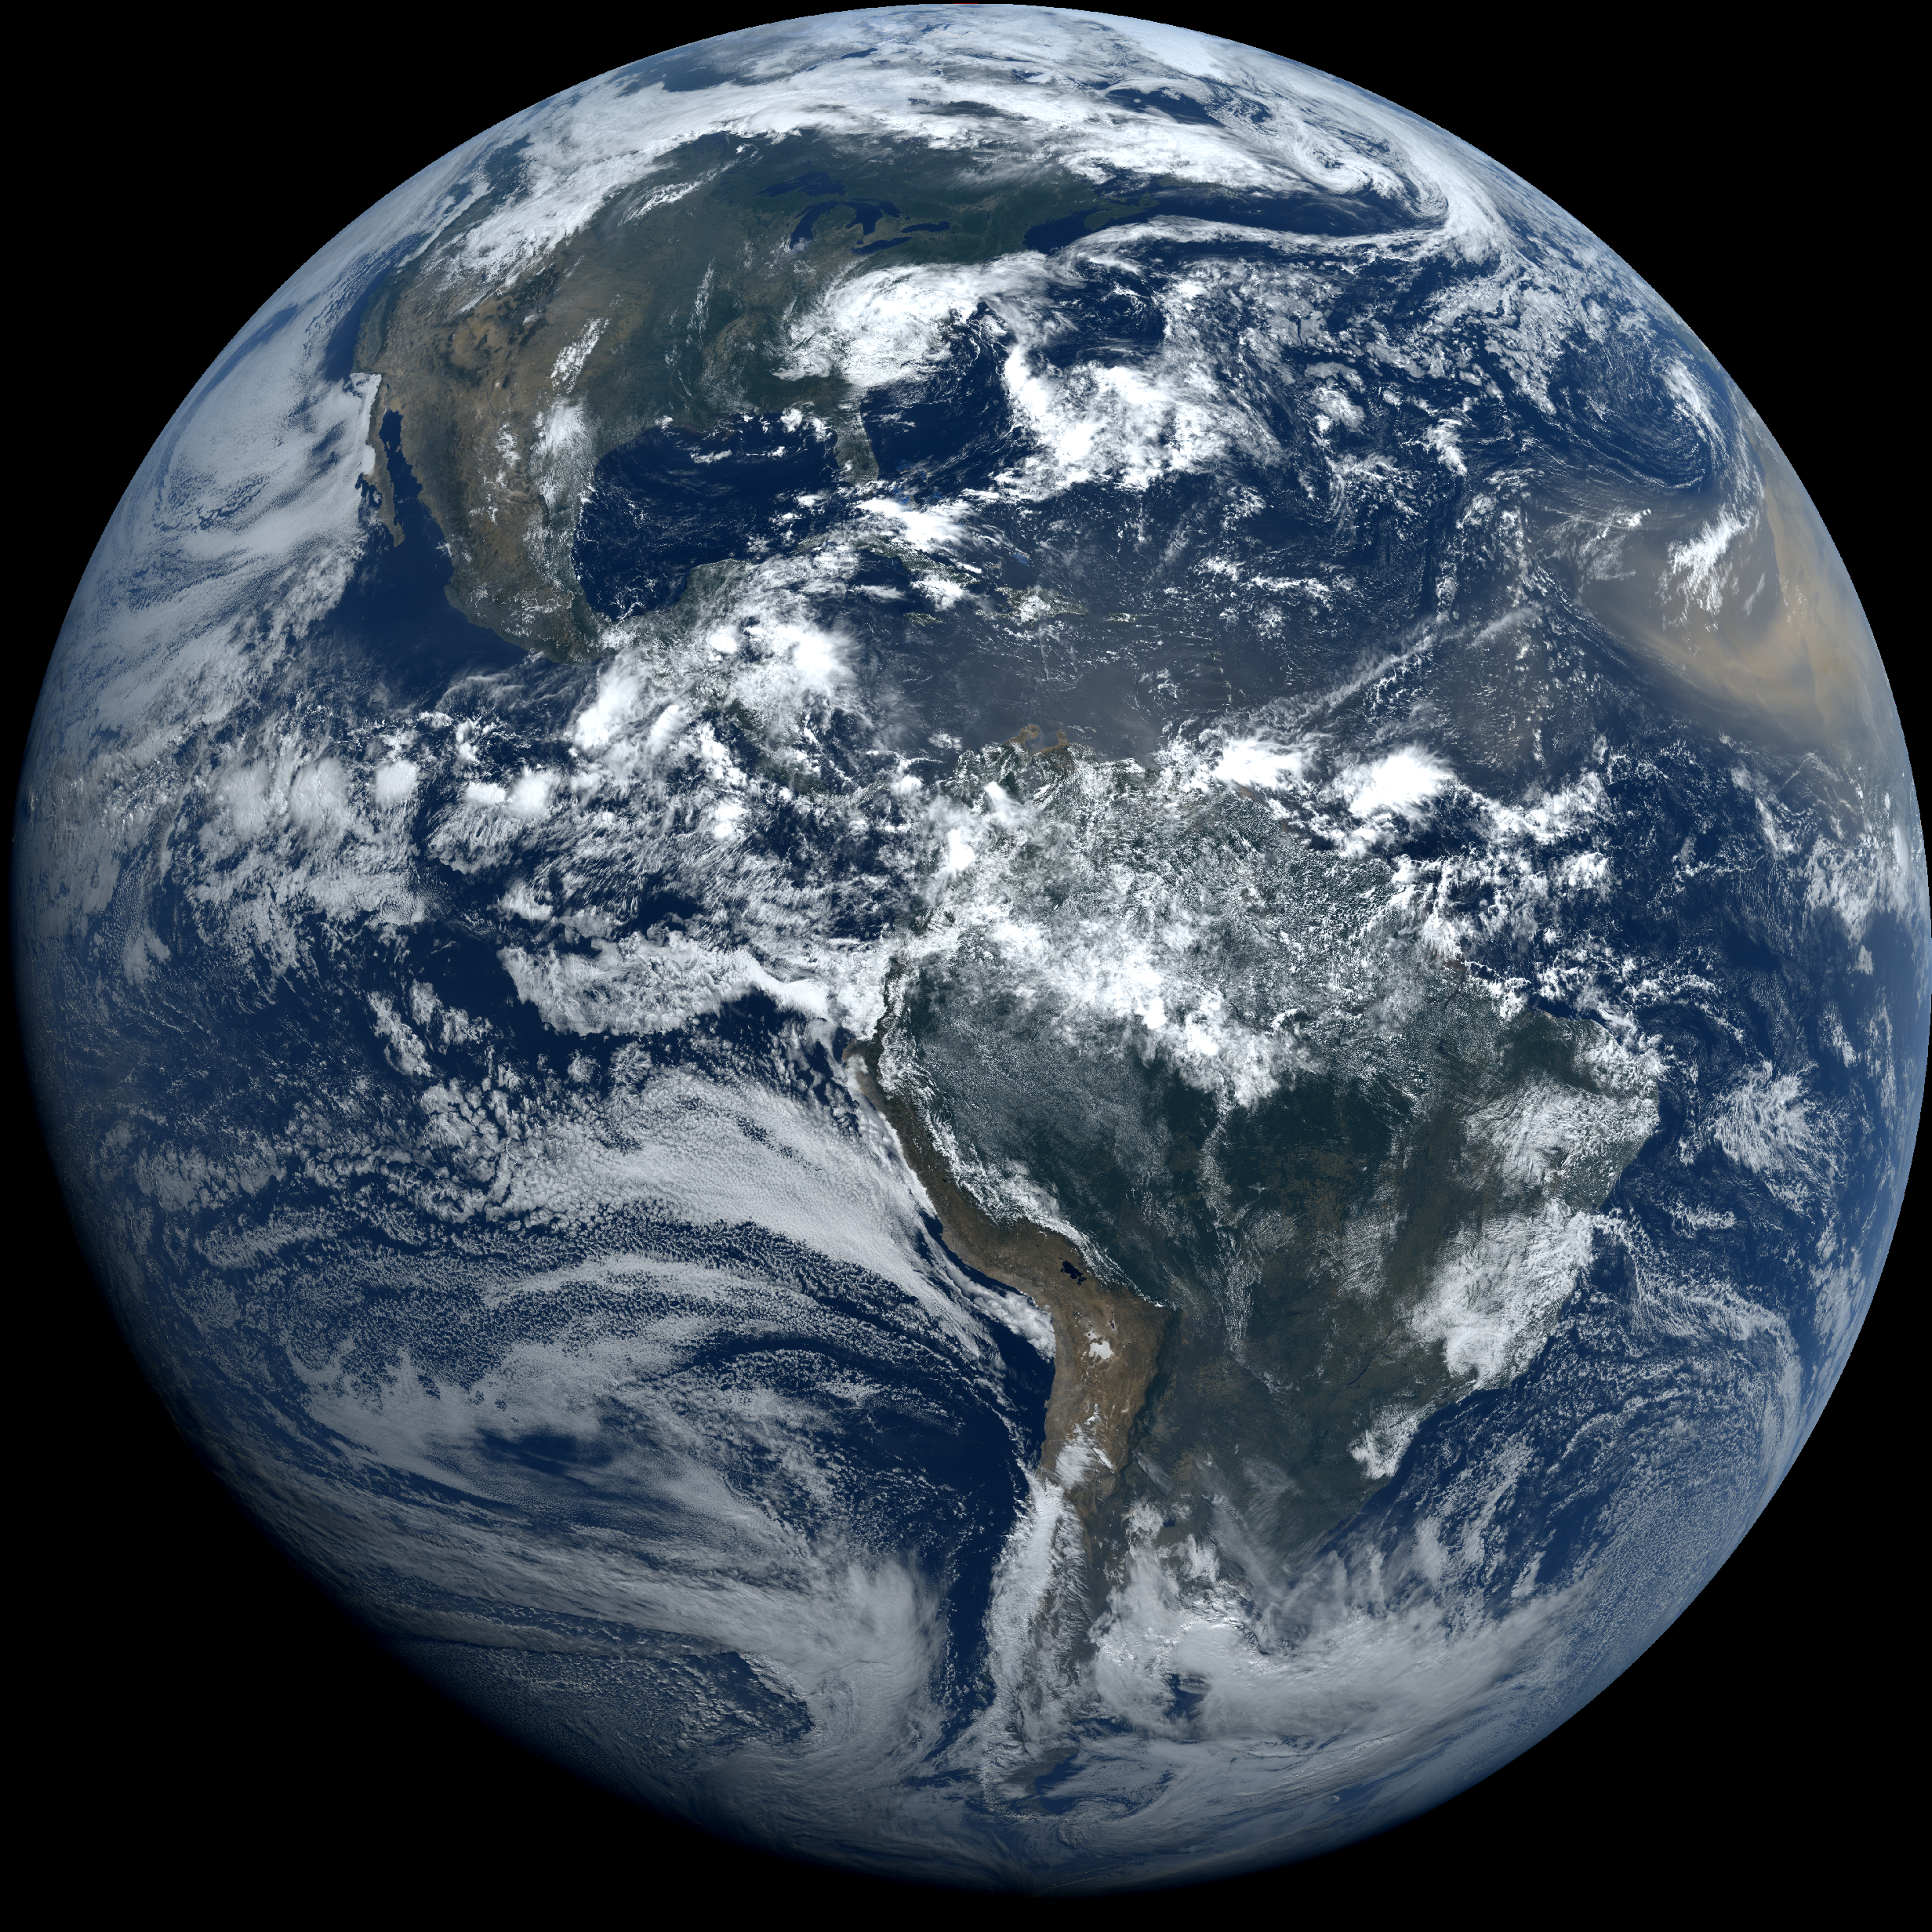
Below is a large, true-color image of Earth I rendered on June 17th, 2020, in which you can see Saharan dust flowing across the Atlantic, destined to further beautify the Caribbean: